Basic
Axis labels are in LaTeX syntax. Axis units are automatically wrapped with parentheses. Upper x-limit and tick mark spacing for the x-axis are user specified.
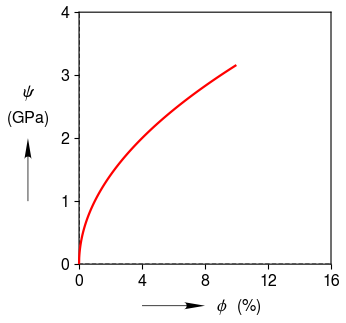
import clearplot.plot_functions as pf
import numpy as np

x = np.arange(0,10,0.01)
y = np.sqrt(x)

pf.plot('basic.png', x, y, \
	x_label = [r'\phi', r'\%'], y_label = [r'\psi', 'GPa'], \
    x_lim = [None, 16], x_tick = 4);