Error Bars
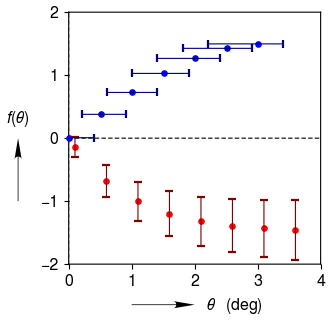
Symmetric vertical error bars, and asymmetric horizontal error bars. (Asymmetric error data is input as a two column numpy array.) Custom data markers.
import clearplot.plot_functions as pf
import numpy as np

xa = np.arange(0.1, 4, 0.5)
ya = 1.5 * np.exp(-xa) - 1.5
#Symmetric vertical error bars
xa_err = None
ya_err = 0.1 + 0.2*np.sqrt(xa)
xb = np.arange(0.01, 3.5, 0.5)
yb = 1.5 * np.sin(xb/2)
#Asymmetric horizontal error bars
xb_err = np.vstack([xb * 0.2 + 0.2, np.ones(xb.shape)*0.4])
yb_err = None

[fig, ax, markers] = pf.plot_markers('', [xa, xb], [ya, yb], \
    x_label = [r'\theta','deg'], y_label = [r'f(\theta)'], shapes = 'o')
ax.plot_error_bars([xa, xb], [ya, yb], \
    x_err = [xa_err, xb_err], y_err = [ya_err, yb_err])
fig.save('error_bars.png')