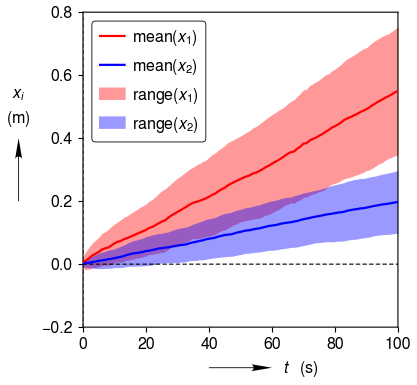
Fill Between Curves
Fill the region between two y curves. Can be useful for showing a range of values.
import clearplot.figure as cp_fig
import numpy as np

# Fixing random state for reproducibility
np.random.seed(19680801)

Nsteps, Nwalkers = 101, 250
t = np.arange(Nsteps)

# an (Nsteps x Nwalkers) array of random walk steps
S1 = 0.0055 + 0.02 * np.random.randn(Nsteps, Nwalkers)
S2 = 0.002 + 0.01 * np.random.randn(Nsteps, Nwalkers)

# an (Nsteps x Nwalkers) array of random walker positions
X1 = S1.cumsum(axis=0)
X2 = S2.cumsum(axis=0)

# Nsteps length arrays empirical means and standard deviations of both
# populations over time
mu1 = X1.mean(axis=1)
sigma1 = X1.std(axis=1)
mu2 = X2.mean(axis=1)
sigma2 = X2.std(axis=1)

fig = cp_fig.Figure()
ax = fig.add_axes()
ax.x_label = ['t', 's']
ax.y_label = ['x_i', 'm']
# ax.y_tick = 0.1
filled_region = ax.fill_between_y_curves(t, mu1 - sigma1, mu1 + sigma1, label = r'\mathsf{range}(x_1)')
ax.plot(t, mu1, labels = [r'\mathsf{mean}(x_1)'])
filled_region = ax.fill_between_y_curves(t, mu2 - sigma2, mu2 + sigma2, label = r'\mathsf{range}(x_2)')
ax.plot(t, mu2, labels = [r'\mathsf{mean}(x_2)'])
ax.add_legend()
fig.auto_adjust_layout()
fig.save('fill_between_curves.png')