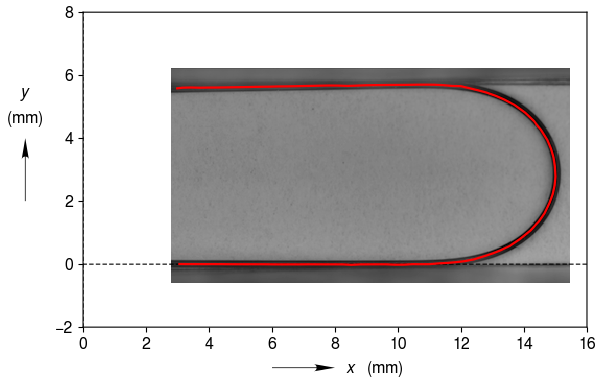
Plot Image and Add Curve
Place an image in the plotting area and add data to the plot afterwards
import clearplot.figure as figure
import matplotlib.pyplot
import os
import numpy as np

#Load image into python
data_dir = os.path.join(os.path.dirname(figure.__file__), os.pardir, 'doc', \
    'source', 'data')
path = os.path.join(data_dir, 'fiber_image.tiff')
im = matplotlib.pyplot.imread(path)
#Specify image position
im_x = np.array([  2.78977515, 15.43370266])
im_y = np.array([ -0.5998, 6.20705447])
#Load edge dectection results
path = os.path.join(data_dir, 'fiber_edge_detection_data.csv')
data = np.loadtxt(path, delimiter = ',')

#Place the image on a set of axes
fig = figure.Figure()
ax = fig.add_axes()
im_obj = ax.add_image(im, x = im_x, y = im_y)
ax.x_label = ['x', 'mm']
ax.y_label = ['y', 'mm']
ax.x_tick = 2
ax.y_tick = 2
ax.x_lim = [0, None]
ax.y_lim = [-2, None]
#Add edge detected data
ax.plot(data[:,0], data[:,1])

#Save the data1
fig.auto_adjust_layout()
fig.save('plot_image_and_add_curve.png')