Two Curves - Legend
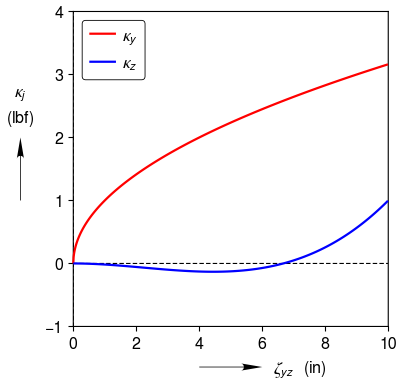
Multiple curves on the same set of axes. Legend displayed. Dashed black line cleary locates zero.
import clearplot.plot_functions as pf
import numpy as np

xa = np.arange(0,10,0.01)
ya = np.sqrt(xa)
xb = xa
yb = 3.0 * (xb/10)**3 - 2.0 * (xb/10)**2

[fig, ax, curves] = pf.plot('two_curves-legend.png', [xa, xb], [ya, yb], \
    labels = [r'\kappa_y', r'\kappa_z'], \
    x_label = [r'\zeta_{yz}', 'in'], y_label = [r'\kappa_j', 'lbf'])