Vertically Stacked Plots
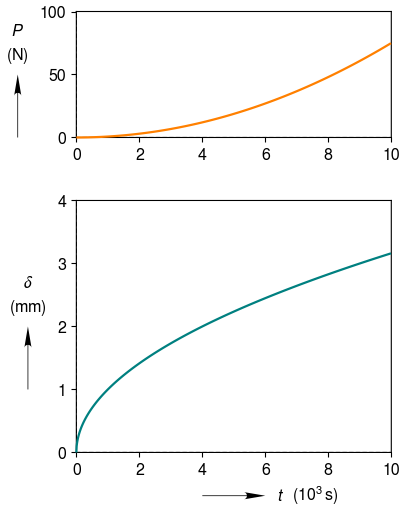
Object oriented interface. Two vertically stacked plots, with the same x-axes. User specified limits and tick spacings for y-axes. User specified line colors.
import clearplot.figure as figure
import numpy as np

xa = np.arange(0,10,0.01)
ya = np.sqrt(xa)
xb = xa
yb = 1.0/2.0 * xb**2.0

fig = figure.Figure()
ax1 = fig.add_axes()
ax1.plot([xa], [ya], curve_colors = [0, 0.5, 0.5])
ax1.x_label = ['t', r'10^3\,s']
ax1.y_label = [r'\delta', 'mm']
ax1.y_lim = [0,4]
ax1.y_tick = 1;

ax2 = fig.add_axes(link_x_ax = ax1)
ax2.plot([xb], [yb*1.5], curve_colors = [1, 0.5, 0])
ax2.y_tick = 50.0
ax2.y_label = ['P', 'N']

fig.auto_adjust_layout()
fig.save('vertically_stacked.png')