Arrows - Custom Tick Labels
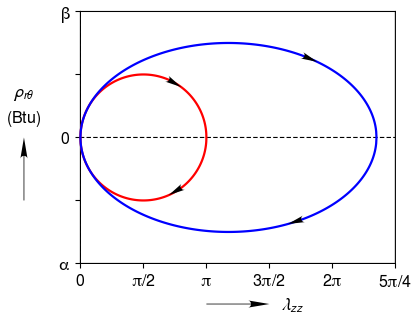
Arrows labeling the curve direction (Arrows positions can be picked interactively when ax.add_arrowheads_to_curves() is given the pick = True keyword argument.) User specified list of strings for x-axis and y-axis tick labels.
import clearplot.plot_functions as pf
import numpy as np

xa = np.arange(0, 1.001, 0.001)
ya = np.sqrt(0.0625 - ((xa-0.5)/2.0)**2.0) * 8.0
xa = np.append(xa, np.flipud(xa))
ya = np.append(ya, -np.flipud(ya))
xb = xa * 2.35
yb = ya * 1.5

[fig, ax, curves] = pf.plot('', [xa, xb], [ya, yb], \
    x_label = [r'\lambda_{zz}'], y_label = [r'\rho_{r\theta}', 'Btu']);
ax.x_tick_labels = ['0', r'\pi/2', r'\pi', r'3\pi/2', r'2\pi', r'5\pi/4']
ax.y_tick_labels = [r'\alpha', '', '0', '', r'\beta']
ax.add_arrowheads_to_curves(ndx = [[800, 1300], [800, 1300]])
fig.save('arrows-custom_tick_labels.png')