Log - Log Plot
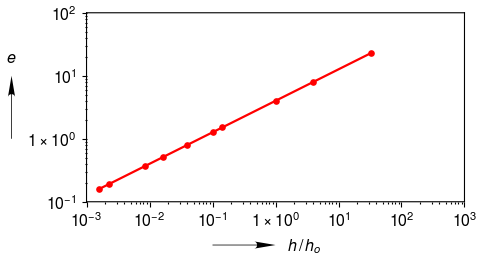
Log - Log Plot. Data points denoted by circular markers. User specified limits for x-axis.
import clearplot.plot_functions as pf
import numpy as np

x = np.array([33.0, 4.0, 1.0, 1.0/7.0, 1.0/10.0, 1.0/25.0, 1.0/60.0, \
    1.0/120.0, 1.0/439.0, 1.0/645.0])
y = 4.0 * x**0.5

pf.plot('log_log_plot.png', x, y, \
    x_label = [r'h\,/\,h_o'], y_label = ['e'], \
    x_scale = 'log', y_scale = 'log', x_lim = [None, 1000], \
    marker_shapes = 'o', marker_edge_widths = 0)