Contour Plot
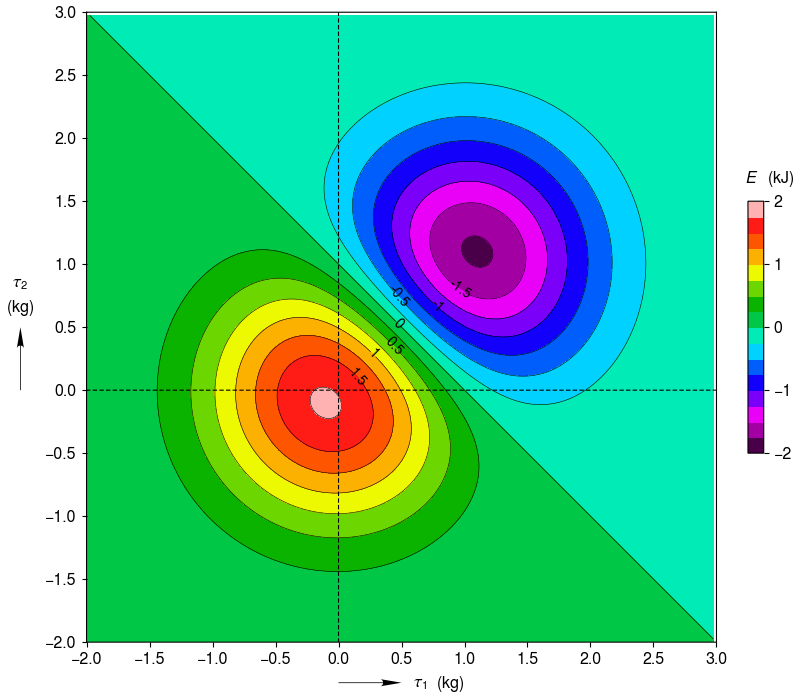
Filled contour plot with colorbar. Options exist to plot only contour lines or to overlay the contour lines over the z data plotted as an image.
import clearplot.plot_functions as pf
import numpy as np

delta = 0.025
x = np.arange(-2.0, 3.0, delta)
y = np.arange(-2.0, 3.0, delta)
X, Y = np.meshgrid(x, y)
Z1 = np.exp(-X**2 - Y**2)
Z2 = np.exp(-(X - 1)**2 - (Y - 1)**2)
Z = (Z1 - Z2) * 2

pf.plot_contours('contour_plot-filled.png', X, Y, Z, [r'\tau_1', 'kg'], \
    [r'\tau_2', 'kg'], x_tick = 0.5, y_tick = 0.5, c_label = ['E', 'kJ']);