Two Y Axes
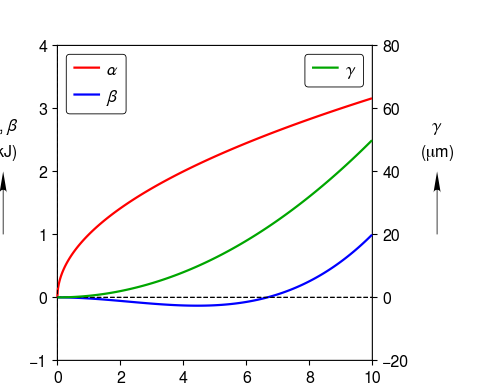
Object oriented interface. Two y-axes. Two curves on the first y-axis. One curve on the second y-axis. User specified limits for y-axes. Legends displayed.
import clearplot.figure as figure
import numpy as np

xa = np.arange(0,10,0.01)
ya = np.sqrt(xa)
xb = xa
yb = 3.0 * (xb/10)**3 - 2.0 * (xb/10)**2
xc = xa
yc = 1.0/2.0 * xc**2.0

fig = figure.Figure()
ax1 = fig.add_axes()
ax1.plot([xa, xb], [ya, yb], labels = [r'\alpha', r'\beta'])
ax1.x_label = ['A', r'mm^2']
ax1.y_label = [r'\alpha,\,\beta', 'kJ']
ax1.y_lim = [-1, None]
ax1.add_legend(loc = 'upper left')

ax2 = fig.add_axes(share_x_ax = ax1)
ax2.plot([xc], [yc], labels = [r'\gamma'], curve_colors = [0,0,1])
ax2.add_legend(loc = 'upper right')
ax2.y_lim = [-20, 80]
ax2.y_label = [r'\gamma',r'\mu m']

fig.auto_adjust_layout()
fig.save('two_y_axes.png')