Symlog - Linear Plot
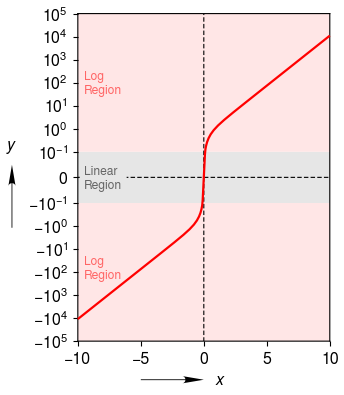
Symlog - Linear Plot. Logarithmic and linear regions denoted with horizontal rectangles.
import clearplot.figure as cpfig
import numpy as np

#Define curve to be plotted
x = np.hstack([np.flipud(-np.logspace(-2, 1, 20)), np.logspace(-2, 1, 20)])
y = np.sinh(x)

#Set up axes and plot data
fig = cpfig.Figure()
ax = fig.add_axes()
ax.x_label = ['x']
ax.y_label = ['y']
ax.y_tick_mm = 8
ax.y_scale = 'symlog'
lin = 1e-1
ax.y_lin_half_width = lin
ax.plot(x, y)

#Mark the linear and log regions
ax.add_h_rect([ax.y_lim[0], -lin], color = [1, 0.9, 0.9])
ax.add_text(np.array([2,20]), "Log\nRegion", font_size = 12, \
            color = [1, 0.4, 0.4])
ax.add_h_rect([-lin, lin], color = [0.9, 0.9, 0.9])
ax.add_text(np.array([2,48.4]), "Linear\nRegion", font_size = 12, \
            color = [0.4, 0.4, 0.4], \
            bbox=dict(facecolor=[0.9, 0.9, 0.9], linewidth = 0))
ax.add_h_rect([lin, ax.y_lim[1]], color = [1, 0.9, 0.9])
ax.add_text(np.array([2,78.7]), "Log\nRegion", font_size = 12, \
            color = [1, 0.4, 0.4])

#Save
fig.auto_adjust_layout()
fig.save('symlog_linear_plot.png')